 Driver recognition programs are often associated with plaques, anniversary awards, or employee appreciation events. While those efforts can certainly boost morale, the most effective recognition programs go much deeper. When built thoughtfully, they can directly support safer operations, stronger communication, and better long-term retention.
In trucking, where safety and consistency matter every day, recognition gives employers a way to reinforce the behaviors they want repeated across the fleet. When strong performance is acknowledged consistently, drivers are more likely to stay engaged with company expectations and take pride in the work they do.
Recognition programs do not need to be complicated or expensive to make an impact. The key is creating systems that feel fair, measurable, and connected to the realities drivers face on the road.
Rewarding Safe Driving Reinforces Positive Habits
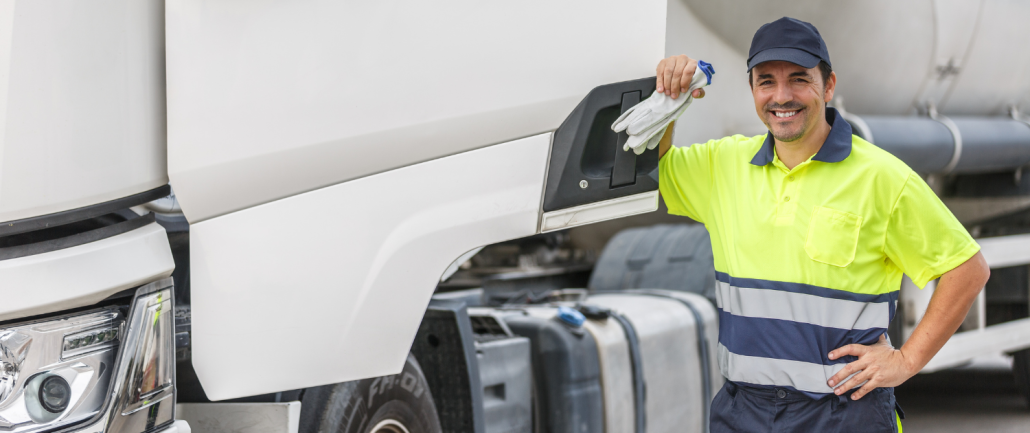
Safety reminders and corrective coaching are necessary parts of fleet management, but recognition plays an important role as well. Drivers are more likely to stay engaged with safety initiatives when they see that safe performance is actively valued by the company.
Programs that reward safe driving help reinforce behaviors such as:
- Maintaining clean inspection records
- Avoiding preventable accidents
- Following hours-of-service regulations
- Consistent seatbelt usage
- Reducing hard braking or speeding events
- Completing safety training programs
Recognition can take many forms. Some companies offer quarterly bonuses tied to safety metrics, while others highlight drivers in newsletters, meetings, or internal communications. Public acknowledgment can be especially meaningful when it comes from leadership or peers.
It’s also important to remember that recognition programs should focus on consistency, not perfection. Drivers operating in difficult weather, heavy traffic, or demanding freight conditions need goals that feel realistic and attainable. A program that only rewards flawless records over several years may feel out of reach for newer drivers or those running more challenging routes.
Clear standards and regular communication also help programs feel credible. Drivers want to understand exactly what is being measured and how rewards are earned.
Recognition Helps Improve Morale and Retention
Retention remains one of the biggest challenges facing trucking companies. Pay and benefits matter, but drivers also pay close attention to how they are treated and whether their work feels appreciated.
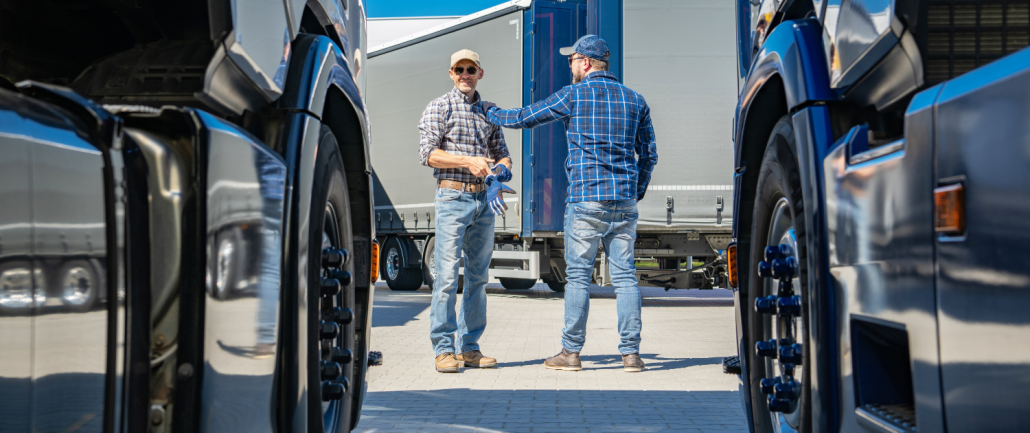
A driver who consistently performs well without acknowledgment may eventually feel overlooked, especially in high-pressure environments where communication often centers around problems, delays, or compliance issues. Recognition creates opportunities for more positive interactions between drivers, dispatchers, managers, and safety teams.
That does not mean every milestone needs a major celebration. Small, consistent efforts often carry more weight than occasional large gestures. Simple examples include:
- Celebrating safety milestones monthly
- Recognizing years of service
- Highlighting driver accomplishments in company updates
- Thanking drivers for handling difficult routes or situations
- Offering performance-based incentives tied to safety or reliability
These efforts help build a workplace culture where drivers feel visible and respected instead of interchangeable.
Recognition can also improve onboarding and early retention. New hires who quickly see examples of positive reinforcement are more likely to understand company expectations and feel motivated to stay engaged.
Strong Recognition Programs Encourage Accountability Across Teams
Recognition programs can also improve communication and accountability throughout the organization.
In strong fleet cultures, safety is not viewed as the responsibility of one department alone. Dispatchers, managers, maintenance teams, and drivers all contribute to operational performance. Recognition programs can help reinforce that shared responsibility.
For example, you could consider recognizing:
- Driver and dispatcher teams with strong on-time and safety performance
- Terminals with improved inspection scores
- Maintenance teams supporting lower breakdown rates
- Mentors helping onboard new drivers successfully
This approach encourages collaboration rather than competition alone. Drivers are more likely to communicate openly when they feel supported instead of monitored purely for mistakes.
Peer recognition can also be just as valuable. Drivers often respect feedback and acknowledgment from fellow drivers who understand the realities of the job firsthand. Some fleets create nomination systems where employees can recognize coworkers for professionalism, safety, or teamwork.
Tie Recognition to Measurable Goals
The strongest recognition programs are tied to measurable performance standards rather than vague impressions. When expectations are unclear, programs can quickly feel inconsistent or unfair. Drivers should know exactly what behaviors or results are being rewarded.
Common performance metrics could include:
- Safe driving scores
- CSA performance
- On-time delivery percentages
- Fuel efficiency improvements
- Inspection results
- Attendance and reliability
- Training participation
- Customer feedback scores
It is also important to balance productivity goals with safety expectations. Drivers should never feel pressured to prioritize speed over safe operation in pursuit of recognition.
Employers should regularly review their programs to ensure goals remain realistic and aligned with company priorities. Gathering driver feedback can help identify areas where recognition efforts may feel disconnected from daily operations.
Building a Culture Drivers Want to Be Part Of
Recognition programs are not a substitute for competitive pay, reliable equipment, or strong leadership. However, they can play a major role in shaping company culture and reinforcing the behaviors that support safer, more engaged teams.
Drivers who feel appreciated are often more invested in communication, safety, and long-term performance. Over time, that can contribute to stronger retention, better morale, and a more stable operation overall.
For more ways to stay ahead of the curve in the transportation industry in 2026, be sure to check out the rest of our Employer Blog posts and connect with us on social media.

 In a competitive hiring market, it can be tempting to present your company in the best possible light. Recruiters want to attract attention, fill seats quickly, and
  The first quarter of the year offers trucking companies an important opportunity to pause and evaluate their workforce. After the holiday freight rush and the start-of-year
  As the trucking workforce continues to evolve, many companies are seeing new demographics, backgrounds, and career experiences represented across their teams.
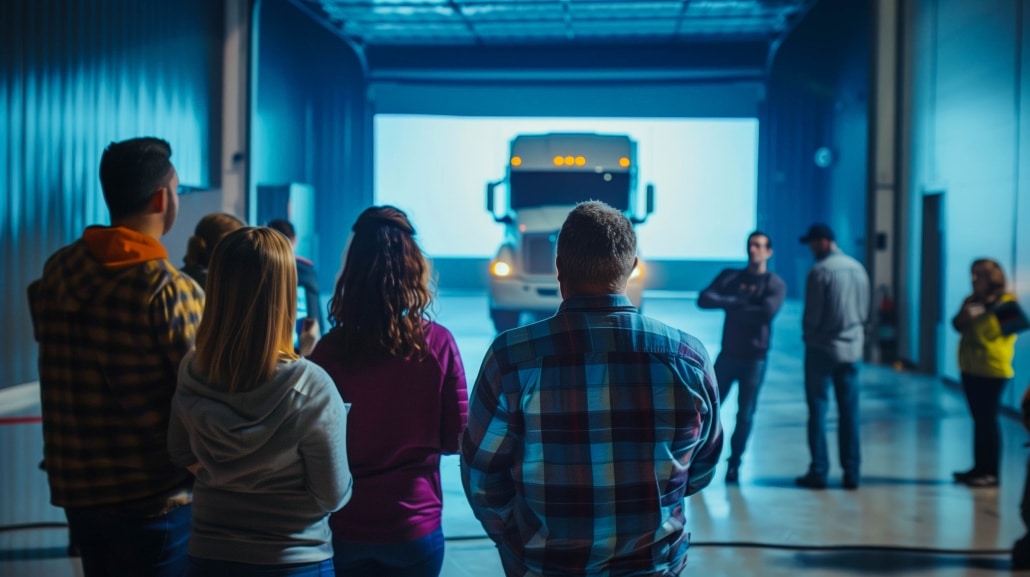
 Work-life balance has become a defining factor in driver satisfaction and long-term retention. While trucking will always involve time on the road, today’s drivers are increasingly selective about employers who respect their time, health, and personal commitments. Carriers that prioritize balance are better positioned to attract experienced drivers, reduce burnout, and build a more engaged workforce.
 Driver retention continues to be one of the most pressing challenges for trucking companies. While recruiting new drivers is essential, retaining experienced ones is often more impactful and cost effective. Every driver that departs represents lost knowledge, disrupted operations, and additional hiring costs for your company.
  In a labor market where demand for qualified CDL drivers remains consistently high, a well-constructed sign-on bonus program can be a powerful tool for recruiting quality talent.